Pre-Summer Special Limited Time 70% Discount Offer - Ends in 0d 00h 00m 00s - Coupon code: validbest

Exam Analytics-DA-201 All Questions

View all questions & answers for the Analytics-DA-201 exam

Salesforce Tableau Data Analyst Analytics-DA-201 Question # 12 Topic 2 Discussion

Analytics-DA-201 Exam Topic 2 Question 12 Discussion:
Question #: 12
Topic #: 2

You have a database that includes field named sales, City and Region.

You have the following chart that shows the number of sales made in different cities.
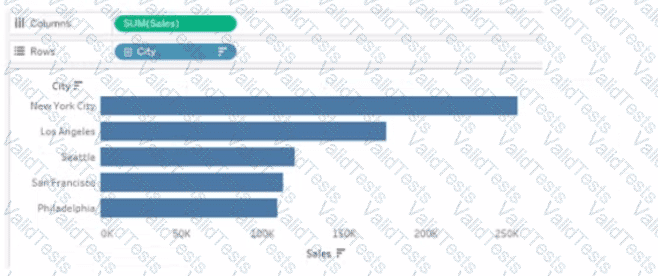
Analytics-DA-201 Question 12

You want to dynamically show the corresponding region when users hover their mouse over any of the bars.

What should you do?


A.

Right-click a in the chat, select Annotate and then select Mark.


B.

Right-click a bar in the chart select Mark Label and then select Always show.


C.

Edit the aliases for City.


D.

Drag Region to Tooltip on the Marks card


Get Premium Analytics-DA-201 Questions

Contribute your Thoughts:


Chosen Answer:
This is a voting comment (?). It is better to Upvote an existing comment if you don't have anything to add.