Pre-Summer Special Limited Time 70% Discount Offer - Ends in 0d 00h 00m 00s - Coupon code: validbest

Exam Desktop-Specialist All Questions

View all questions & answers for the Desktop-Specialist exam

Tableau Desktop Specialist Desktop-Specialist Question # 39 Topic 5 Discussion

Desktop-Specialist Exam Topic 5 Question 39 Discussion:
Question #: 39
Topic #: 5

Using the Time Series Table, create a Line chart showing the Monthly Year over Year Growth for the Sales, broken down by Assortment. For the Electronics assortment, which Month had the most NEGATIVE value of Year over Year Growth?

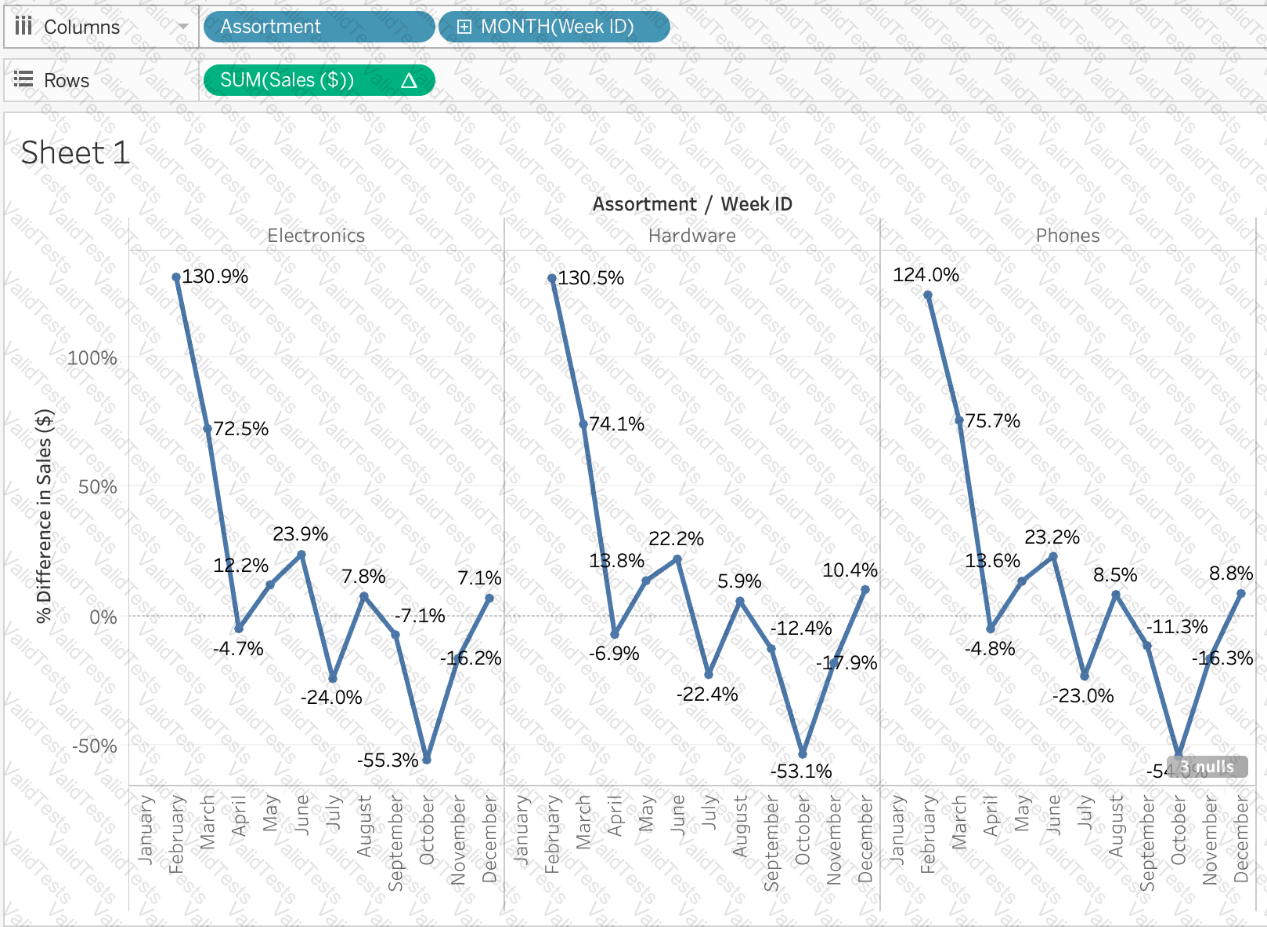
Using the Time Series Table, create a Line chart showing the Monthly Year over Year Growth for the Sales, broken down by Assortment. For the Electronics assortment, which Month had the most NEGATIVE value of Year over Year Growth?


A.

October


B.

September


C.

July


D.

June


Get Premium Desktop-Specialist Questions

Contribute your Thoughts:


Chosen Answer:
This is a voting comment (?). It is better to Upvote an existing comment if you don't have anything to add.