
View all questions & answers for the Desktop-Specialist exam
You have the following visualization.
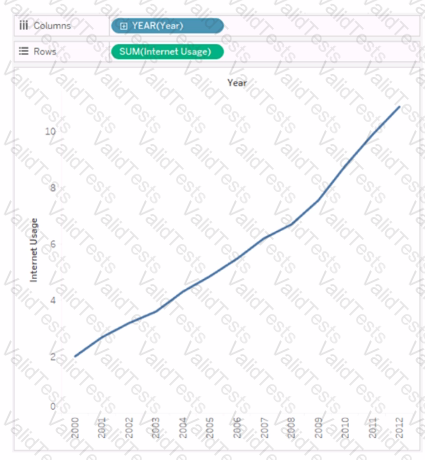
You need to show how Internet Usage values change from year-to-year as a percentage. Which quick table calculation should you apply to the Internet Usage field?


Submit