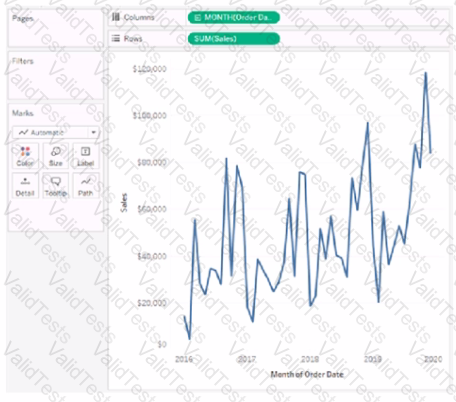
To display multiple distinct lines on the same axis based on a field, you should place the field on the Color shelf in the Marks card. This will encode each distinct value in the Region field with a different color, resulting in separate lines for each region on the same axis.
Contribute your Thoughts:
Chosen Answer:
This is a voting comment (?). You can switch to a simple comment. It is better to Upvote an existing comment if you don't have anything to add.



Submit