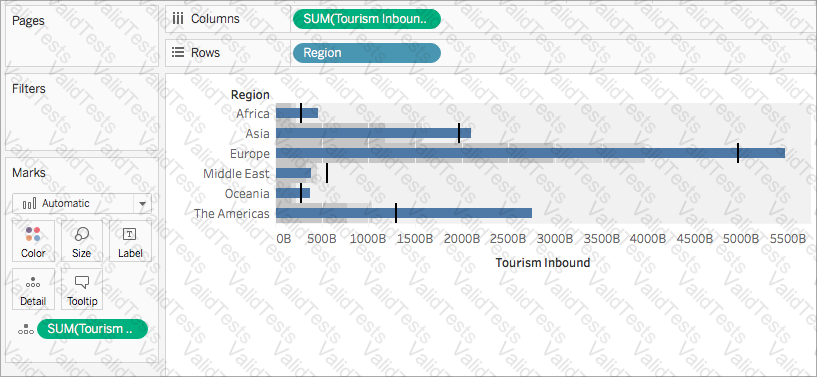
A bullet graph is a variation of a bar graph developed to replace dashboard gauges and meters. A bullet graph is useful for comparing the performance of a primary measure to one or more other measures. Below is a single bullet graph showing how actual sales compared to estimated sales.
Chosen Answer:
This is a voting comment (?). You can switch to a simple comment. It is better to Upvote an existing comment if you don't have anything to add.



Submit