Activity diagrams are another type of UML diagram used to model the workflow or flow of control within a system.
They visually represent the steps performed by a system to complete a specific activity.
They use a set of symbols, including rounded rectangles for activities, diamonds for decisions, and arrows to show the flow between steps.
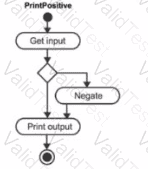
The activity diagram shows the workflow of a process called "PrintPositive".
It starts with a single initial state (represented by a black circle) labeled "Get Input".
There's a decision diamond labeled "Negative?" with two paths.
The "Yes" path leads to an activity "Negate".
The "No" path leads directly to an activity "Print Output".
Both paths end with a black circle labeled "End".
How it describes the execution flow:
The diagram indicates that the process starts by getting some input.
Then, there's a decision made based on whether the input is negative.
If it's negative, the value is negated.
In either case (positive or negative), the output is printed.
Finally, the process ends.
Summary:
The activity diagram captures the steps involved in the "PrintPositive" activity, including the decision-making process and the alternative paths based on the input. This aligns with the purpose of describing the execution flow.
Contribute your Thoughts:
Chosen Answer:
This is a voting comment (?). You can switch to a simple comment. It is better to Upvote an existing comment if you don't have anything to add.

Submit