Pre-Summer Special Limited Time 70% Discount Offer - Ends in 0d 00h 00m 00s - Coupon code: validbest

Pass the CompTIA Data+ DA0-001 Questions and answers with ValidTests

Exam DA0-001 All Questions
Exam DA0-001 Premium Access

View all detail and faqs for the DA0-001 exam

Viewing page 5 out of 12 pages
Viewing questions 41-50 out of questions
Questions # 41:

An analyst needs to summarize the number of people in Chicago in 2022 using the following set of data:

Question # 41

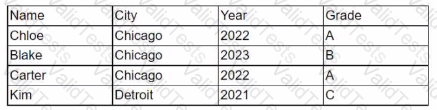
Which of the following steps should the analyst use to provide results? (Select two).

Options:

A.

Aggregation

B.

Sorting

C.

Filtering

D.

Indexing

E.

Cleaning

F.

Replacing

Expert Solution
Questions # 42:

An e-commerce company recently tested a new website layout. The website was tested by a test group of customers, and an old website was presented to a control group. The table below shows the percentage of users in each group who made purchases on the websites:

Question # 42

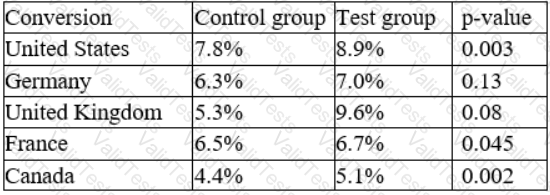
Which of the following conclusions is accurate at a 95% confidence interval?

Options:

A.

In Germany, the increase in conversion from the new layout was not significant.

B.

In France, the increase in conversion from the new layout was not significant.

C.

In general, users who visit the new website are more likely to make a purchase.

D.

The new layout has the lowest conversion rates in the United Kingdom.

Expert Solution
Questions # 43:

Mario works with a group of R programmers tasked with copying data from an accounting system into a data warehouse.

In what phase are the group's R skills most relevant?

Options:

A.

Extract.

B.

Load.

C.

Transform.

D.

Purge.

Expert Solution
Questions # 44:

An analyst is reporting on the average income for a county and is reviewing the following data:

Question # 44

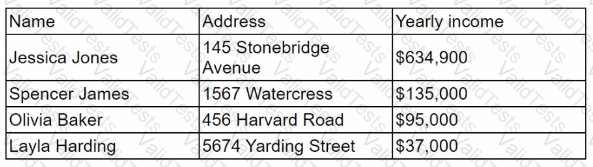
Which of the following is the reason the analyst would need to cleanse the data in this data set?

Options:

A.

Data completeness

B.

Data outliers

C.

Duplicate data

D.

Missing values

Expert Solution
Questions # 45:

A data analyst is setting up a data dashboard to monitor several ETL data streams to ensure that data is complete for later analysis. Which of the following audiences should the analyst target for this dashboard?

Options:

A.

Executives

B.

The management team

C.

Technical experts

D.

External vendors

Expert Solution
Questions # 46:

A data analyst is creating a report that will provide information about various regions, products, and time periods. Which of the following formats would be themost efficient way to deliver this report?

Options:

A.

A workbook with multiple tabs for each region

B.

A daily email with snapshots of regional summaries

C.

A static report with a different page for every filtered view

D.

A dashboard with filters at the top that the user can toggle

Expert Solution
Questions # 47:

Which of the following types of dashboards should a business intelligence engineer develop in order to provide information about failed data pipelines?

Options:

A.

Referencing

B.

Strategic

C.

Operational

D.

Technical

Expert Solution
Questions # 48:

Which of the following best describes a difference between JSON and XML?

Options:

A.

JSON is quicker to read and write.

B.

JSON has to use an end tag.

C.

JSON strings are longer

D.

JSON is much more difficult to parse.

Expert Solution
Questions # 49:

A data analyst is performing a data merge within a spreadsheet using the tables below:

https://www.bing.com/images/blob?bcid=S1XCF9p02M4GjpbGxHj0lrIaj9sw.....4c Question # 49

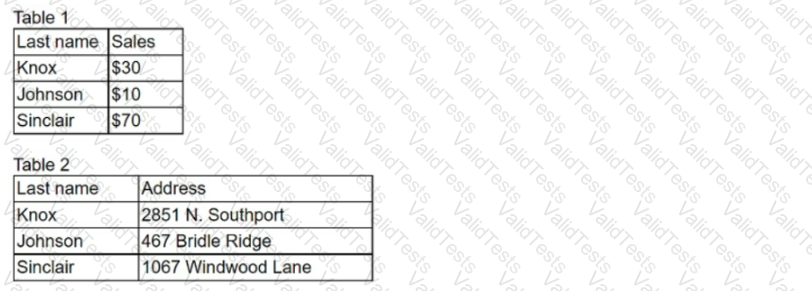
The analyst is attempting to pull the addresses from Table 2 into Table 1 using the last names and is receiving an error message. Which of the following steps can the analyst perform to fix the error?

Options:

A.

Use concatenate to combine the tables.

B.

Ensure the formula is pulling from right to left.

C.

Sort the data by the last name field.

D.

Review the spelling and data type.

Expert Solution
Questions # 50:

Which of the following BEST describes standard deviation?

Options:

A.

A measure that is used to establish a relationship between two variables

B.

A measure of how data is distributed

C.

A measure of the amount of dispersion of a set of values

D.

A measure that is used to find the significant difference between variables

Expert Solution
Viewing page 5 out of 12 pages
Viewing questions 41-50 out of questions