Pre-Summer Special Limited Time 70% Discount Offer - Ends in 0d 00h 00m 00s - Coupon code: validbest

Pass the Qlik Sense Business Analyst QSBA2024 Questions and answers with ValidTests

Exam QSBA2024 All Questions
Exam QSBA2024 Premium Access

View all detail and faqs for the QSBA2024 exam

Viewing page 2 out of 2 pages
Viewing questions 11-20 out of questions
Questions # 11:

Refer to the exhibit.
Question # 11

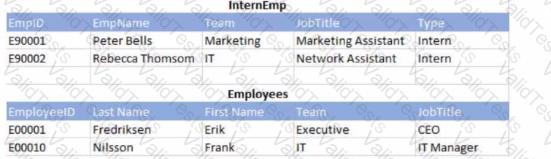
An app that will track experiments for rodents (e.g., rats and mice) that navigate mazes (labyrinths) is being developed. Individual rodents are catalogued in the Rodent table, while the Mazes table has metadata for the mazes. The MazeEscapes table holds a record of each attempt at a maze by a rodent. A business analyst needs to build a KPI that will allow users to see how many rodents have made at least one attempt at any maze.

How should the analyst construct the KPI?
Options:

A.

• Create RodentlD AS RodentID_Counter in the MazeEscapes table.

• Use Count (Distinct RodentlD Counter) as the KPI expression.

B.

• Create 1 AS RodentID_Counter in the Rodent table.

• Use Sum (RodentlD Counter) as the KPI expression.

C.

Create 1 AS RodentID_Counter in the MazeEscapes table.

Use Sum (RodentlD Counter) as the KPI expression.

D.

• Create RodentlD AS RodentlD Counter in the Rodent table.

• Use Count (Distinct RodentID Counter) as the KPI expression.

Expert Solution
Questions # 12:

Question # 12

Question # 12

Refer to the exhibits.

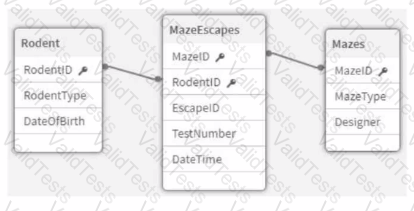
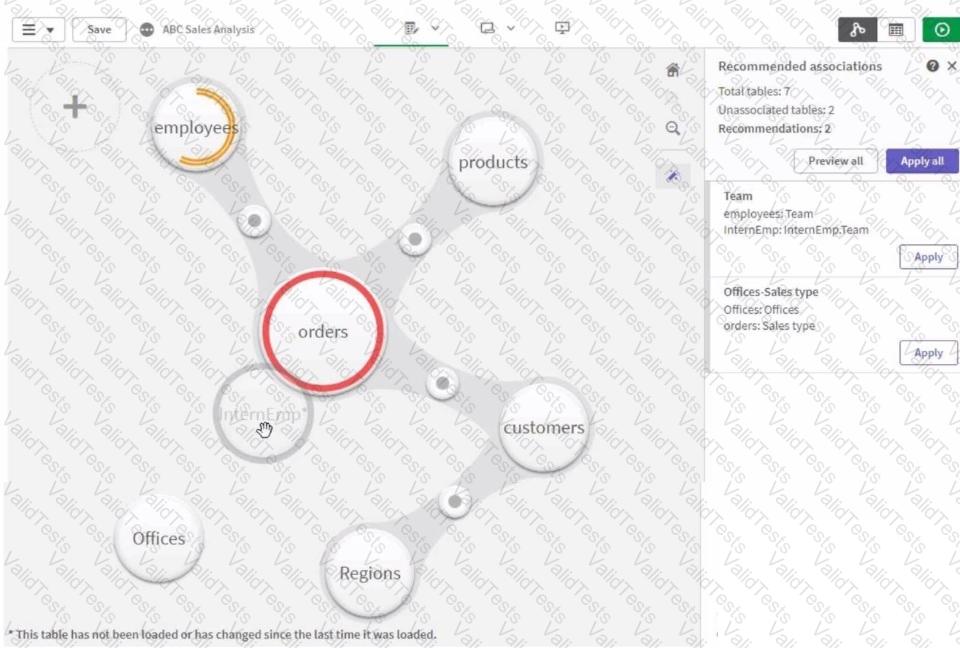
A business analyst must add a list of temporary employees (interns) to the current sales app. The app contains an existing employees table. When the business analyst profiles the data, the association view displays possible associations as shown.

Which action should the business analyst take in Data manager to meet the requirements?

Options:

A.

Create a concatenated key to associate the Employees and InternEmp tables

B.

Concatenate the InternEmp table to the Employees tables within Data manager

C.

Force an association between the InternEmp and the Orders tables

D.

Create an association between the EmpID and EmployeelD fields

Expert Solution
Questions # 13:

The business analyst creates one table by concatenating and joining several source tables. This has resulted in a table of several thousand rows that may have several columns containing between 30% and 70% null values. The business analyst needs to understand the level of null values in each field of this table to determine if this is an issue.

Which capability should the business analyst use?

Options:

A.

Select each field in the Data model viewer and use the Density value to determine the level of nulls

B.

Enable the Preview Panel in the Data model viewer and inspect the data table visually to determine the level of null values

C.

Look at the tags fields for any indication that $null is associated to this field

D.

Inspect each field in the Data model viewer and use the Subset ratio to determine the level of null values

Expert Solution
Questions # 14:

A customer needs to distribute sales data to a variety of teams. The internal analyst team requires a global view of data. The sales team requires mobile device access.

Which solution will meet the needs of both teams?

Options:

A.

One app with a specific extension for mobile users

B.

Two apps: one designed for mobile and one for internal use

C.

A mashup with various objects

D.

One app with various objects

Expert Solution
Questions # 15:

A business analyst is building an app to analyze virus outbreaks. They create a bar chart using a dimension of Continent, and a measure of Sum (Knowningsections). They require a secondary bar on the chart, so they create a second measure using Count (MajorCities).

The bar chart adjusts, but no bars are visible for this second measure. Which action should the business analyst take to resolve this issue?

Options:

A.

Enable Value labels within the Presentation section of the Appearance properties

B.

Recreate the second measure as an alternative measure

C.

Change the Y-axis Range scale from Auto to Custom and select a suitable Max value

D.

Convert the bar chart to a combo chart and reconfigure the second measure to be a bar

Expert Solution
Viewing page 2 out of 2 pages
Viewing questions 11-20 out of questions