
View all detail and faqs for the Analytics-Con-301 exam
A client wants to flag orders that have sales higher than the regional average.
Which calculated field will produce the required result?
A client requests a published Tableau data source that is connected to SQL Server. The client needs to leverage the multiple tables option to create an
extract. The extract will include partial data from the SQL Server data source.
Which action will reduce the amount of data in the extract?
A client needs to design row-level security (RLS) measures for their reports. The client does not currently have Tableau Data Management Add-on, and it
may be an option in the future.
What should the consultant recommend as the safest and easiest way to manage for the long term?
A consultant plans a Tableau deployment for a client that uses Salesforce. The client wants users to automatically see Tableau views of regional sales filtered
by customer as soon as the users sign into Salesforce.
Which approach should the consultant use to deliver the final visualization?
A client currently has a workbook with the table shown below.
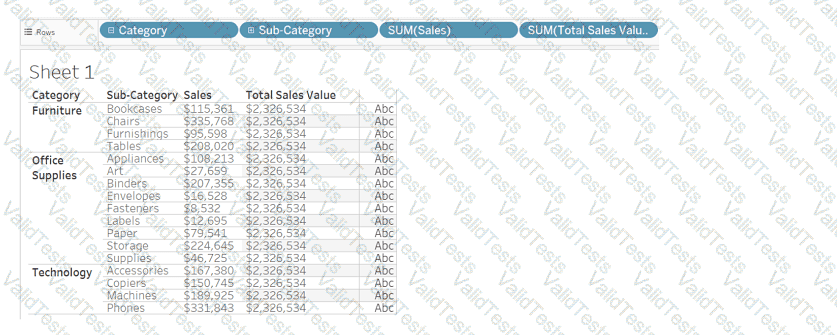
Which method will produce the output for the Total Sales Value field for all the categories shown in the table?
A company has a sales team that is segmented by territory. The team's manager wants to make sure each sales representative can see only data relevant to
that representative's territory in the team Sales Dashboard.
The team is large and has high turnover, and the manager wants the mechanism for restricting data access to be as automated as possible. However, the
team does not have a Tableau Data Management license.
What should the consultant recommend to meet the company's requirements?
From the desktop, open the CC workbook. Use the US Population Estimates data source.
You need to shape the data in US Population Estimates by using Tableau Desktop. The data must be formatted as shown in the following table.
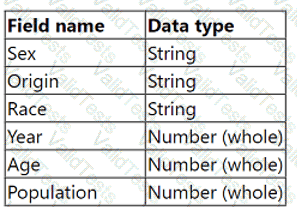
Open the Population worksheet. Enter the total number of records contained in the data set into the Total Records parameter.
From the File menu in Tableau Desktop, click Save.
From the desktop, open the CC workbook.
Open the City Pareto worksheet.
You need to complete the Pareto chart to show the percentage of sales compared to the percentage of cities. The chart must show references lines to visualize how the data compares to the Pareto principle.
From the File menu in Tableau Desktop, click Save.
From the desktop, open the CC workbook.
Open the Incremental worksheet.
You need to add a line to the chart that
shows the cumulative percentage of sales
contributed by each product to the
incremental sales.
From the File menu in Tableau Desktop, click
Save.
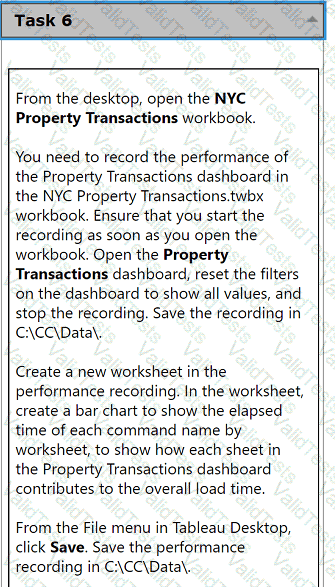
From the desktop, open the NYC
Property Transactions workbook.
You need to record the performance of
the Property Transactions dashboard in
the NYC Property Transactions.twbx
workbook. Ensure that you start the
recording as soon as you open the
workbook. Open the Property
Transactions dashboard, reset the filters
on the dashboard to show all values, and
stop the recording. Save the recording in
C:\CC\Data\.
Create a new worksheet in the
performance recording. In the worksheet,
create a bar chart to show the elapsed
time of each command name by
worksheet, to show how each sheet in
the Property Transactions dashboard
contributes to the overall load time.
From the File menu in Tableau Desktop,
click Save. Save the performance
recording in C:\CC\Data\.