
View all detail and faqs for the CRM-Analytics-and-Einstein-Discovery-Consultant exam
A CRM Analytics consultant is adding direct data into an existing recipe. When trying to click on the input node, data preview is taking a long time to show any results.
How should the consultant resolve this?
CRM Analytics users at Cloud Kicks are granted access to an app with specific dashboards. When trying to download a specific widget, they are unable to do so.
What is causing the issue?
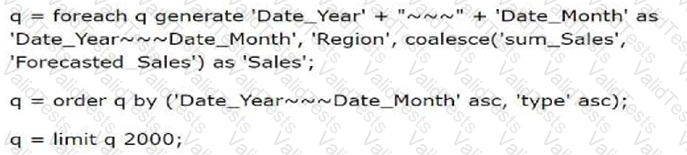
Which timeseries statement will fix the query?
A CRM Analytics consultant has enabled data sync manually in an org that uses dataflows/recipes. The client says that the dataflow/recipe fails each time it starts running.
What is causing the dataflow/recipe to fail?
A team of CRM Analytics developers has been working on an existing recipe to add new derived fields. The edited version has been failing ever since, and management is requesting that the dashboard show refreshed data while they work on the edits.
How can the developers add new fields while keeping the dataset refreshed?
Which statement best describes how to ensure CRM Analytics dashboards are easily used across both desktop and mobile devices?
What is a benefit of introducing a second local connector?
Universal Containers wants to create two dashboards and has two user groups. The 'Regional Performance’ dashboard should be accessible to sales reps and managers/executives to keep track of
how sales reps are performing in each region. Sales reps must only be able to see data pertaining to their respective region. The ‘National Performance’ dashboard is using the same data as the other
dashboard but should only be accessible to managers/executives to compare data across all regions.
In addition to row-level security to view only regional data, how should a consultant ensure that sales reps are unable to view the ‘National Performance’ dashboard?
The marketing team at Cloud Kicks has five dashboards in an app. Four widgets are replicas of each other in three of the dashboards.
What is the best way to maintain these widgets?
Acompany wants to create a timeline chart to visualize the evolution of its Closed Won opportunities.
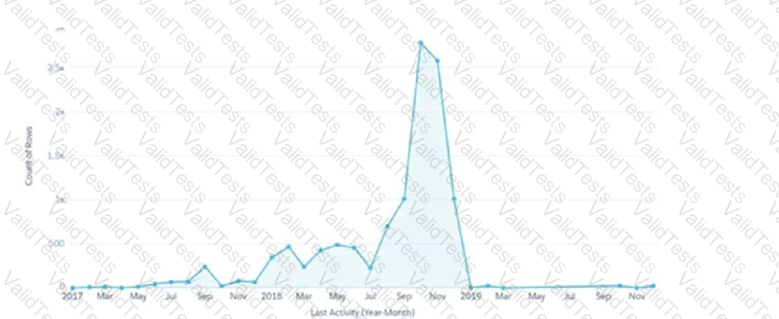
What are the required parameters to build a lens that displays output similar to the image shown?

