Pre-Summer Special Limited Time 70% Discount Offer - Ends in 0d 00h 00m 00s - Coupon code: validbest

Pass the Tableau Desktop Specialist Desktop-Specialist Questions and answers with ValidTests

Exam Desktop-Specialist All Questions
Exam Desktop-Specialist Premium Access

View all detail and faqs for the Desktop-Specialist exam

Viewing page 9 out of 9 pages
Viewing questions 81-90 out of questions
Questions # 81:

How can you create a packaged data source?

Options:

A.

From the Worksheet menu, select Export, and then select Data.

B.

From the Data pane, right-click the data connection, and then select Add to Saved Data Sources.

C.

From the File menu, select Share.

D.

From the File menu, select Save As.

Expert Solution
Questions # 82:

You create a visualization by first adding a measure to rows. Next, you add a dimension wilh 11 members to columns.

Assuming that all the dimensions have a non-zero value, how many marks are in the view before and after the dimension is added?

Options:

A.

1 before and 2 after

B.

1 before and 12 after

C 1 before and 11 after

C.

2 before and 11 after

Expert Solution
Questions # 83:

Which of the following options best describe measures?

Options:

A.

They are categorical, qualitative

B.

They are categorical, quantitative

C.

They are numerical, qualitative

D.

They are numerical, quantitative

Expert Solution
Questions # 84:

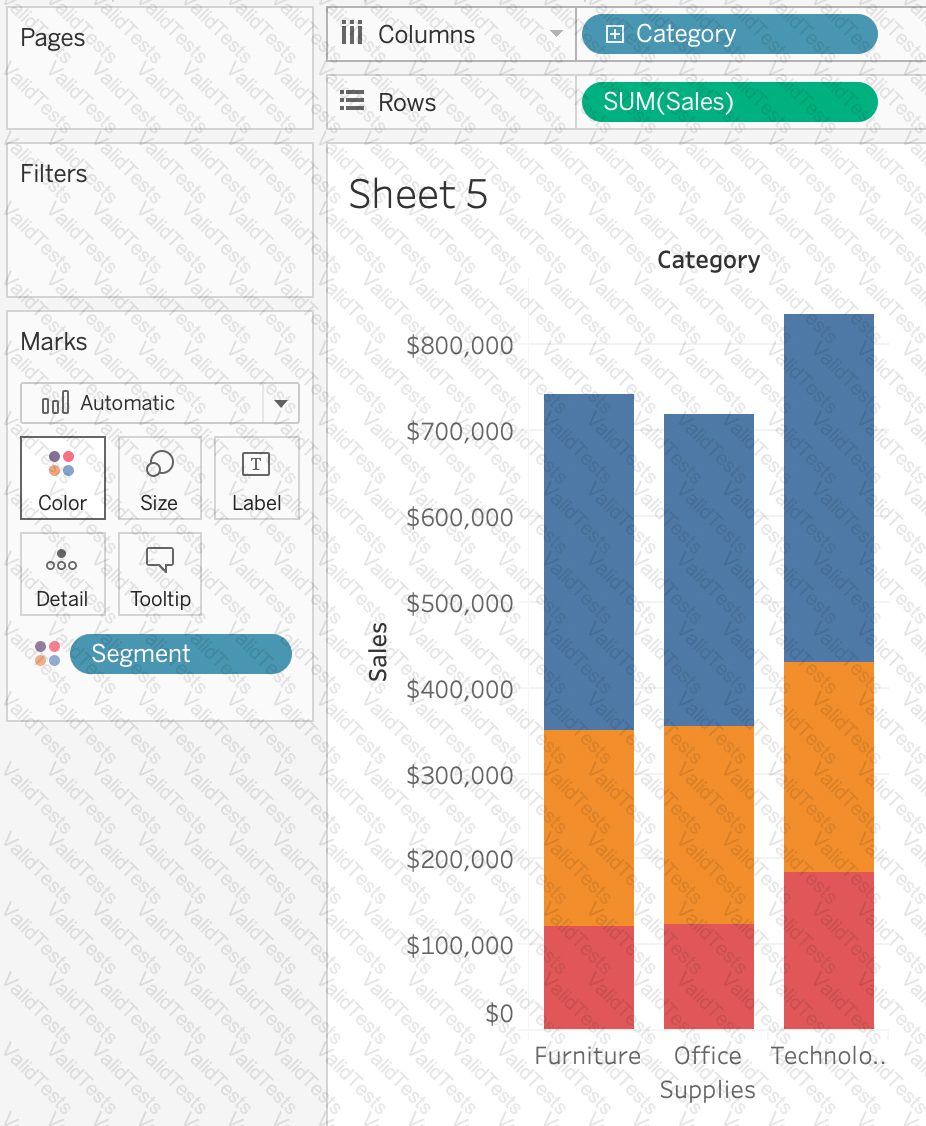
Which of the following are compelling reasons to use a Stacked Bar Chart?

Options:

A.

To visualize parts of a whole

B.

To easily visualize trends over time

C.

To be able to visualize complex information with fewer bars /

marks

D.

To visualize each discrete category using a separate bar.

Expert Solution
Questions # 85:

Which statement accurately describes an extract when the Physical Tables option is selected?

Options:

A.

Data is limited to only the Top N of data for the connection.

B.

All the data is tolled up to the current visible fields.

C.

An individual table is created for each physical table in the extract.

D.

Data shown in the Data pane is separated based on the table type.

Expert Solution
Questions # 86:

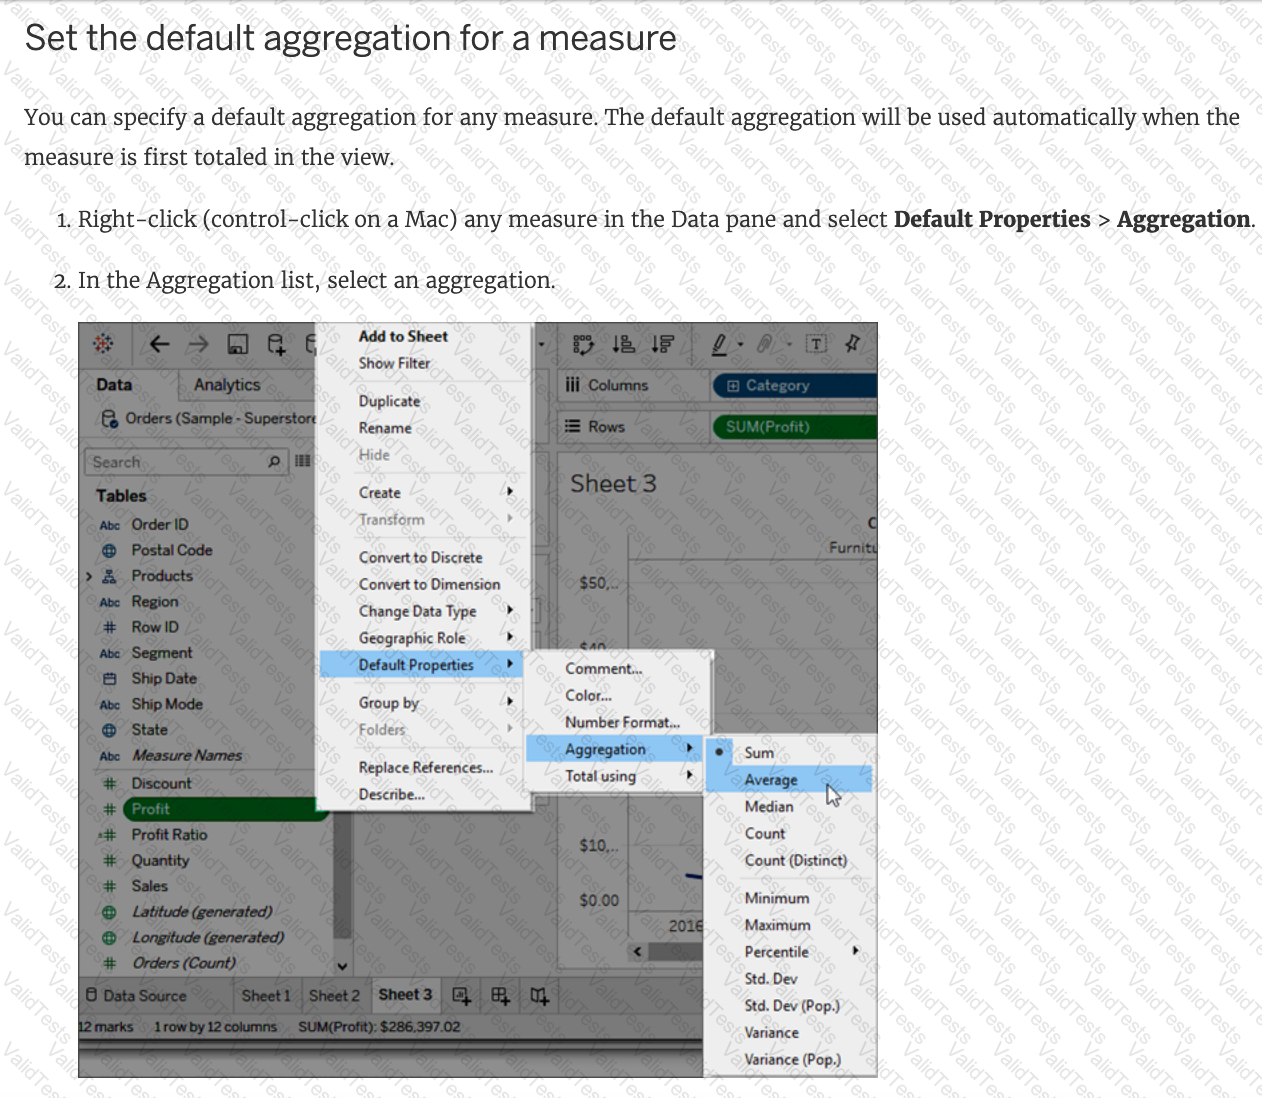
How can you change the Default Aggregation for a measure in Tableau?

Options:

A.

By changing its properties manually every time we need to use it

B.

By right clicking the dimension -> Default properties and choosing Aggregation

C.

By right clicking the measure -> Default properties and choosing Aggregation

D.

By double clicking on the measure, and then choosing Window -> Default Aggregation

Expert Solution
Questions # 87:

Tableau will automatically create a hierarchy for which two kinds of data? Choose two.

Options:

A.

Date & Time

B.

Date

C.

Geographic

D.

String

Expert Solution
Viewing page 9 out of 9 pages
Viewing questions 81-90 out of questions