Pre-Summer Special Limited Time 70% Discount Offer - Ends in 0d 00h 00m 00s - Coupon code: validbest

Pass the Google Cloud DevOps Engineer Professional-Cloud-DevOps-Engineer Questions and answers with ValidTests

Exam Professional-Cloud-DevOps-Engineer All Questions
Exam Professional-Cloud-DevOps-Engineer Premium Access

View all detail and faqs for the Professional-Cloud-DevOps-Engineer exam

Viewing page 6 out of 7 pages
Viewing questions 51-60 out of questions
Questions # 51:

Your organization recently adopted a container-based workflow for application development. Your team develops numerous applications that are deployed continuously through an automated build pipeline to the production environment. A recent security audit alerted your team that the code pushed to production could contain vulnerabilities and that the existing tooling around virtual machine (VM) vulnerabilities no longer applies to the containerized environment. You need to ensure the security and patch level of all code running through the pipeline. What should you do?

Options:

A.

Set up Container Analysis to scan and report Common Vulnerabilities and Exposures.

B.

Configure the containers in the build pipeline to always update themselves before release.

C.

Reconfigure the existing operating system vulnerability software to exist inside the container.

D.

Implement static code analysis tooling against the Docker files used to create the containers.

Expert Solution
Questions # 52:

You use Google Cloud Managed Service for Prometheus with managed collection to gather metrics from your service running on Google Kubernetes Engine (GKE). After deploying the service, there is no metric data appearing in Cloud Monitoring, and you have not encountered any error messages. You need to troubleshoot this issue. What should you do?

Options:

A.

Determine if your service has exceeded its quota for writes to the Cloud Monitoring API.

B.

Check if the Grafana service is installed on your GKE cluster.

C.

Confirm that your service has the monitoring.servicesViewer IAM role.

D.

Verify that your PodMonitoring configuration references a valid port.

Expert Solution
Questions # 53:

You are the on-call Site Reliability Engineer for a microservice that is deployed to a Google Kubernetes Engine (GKE) Autopilot cluster. Your company runs an online store that publishes order messages to Pub/Sub and a microservice receives these messages and updates stock information in the warehousing system. A sales event caused an increase in orders, and the stock information is not being updated quickly enough. This is causing a large number of orders to be accepted for products that are out of stock You check the metrics for the microservice and compare them to typical levels.
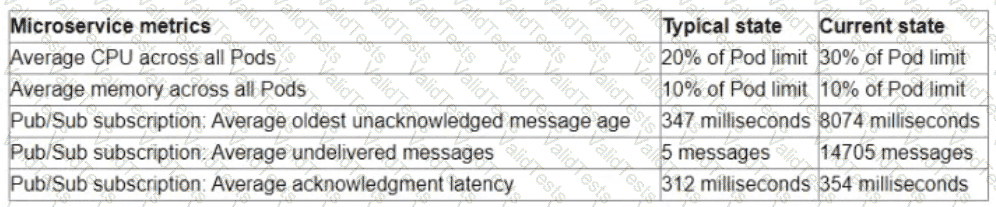
Question # 53

You need to ensure that the warehouse system accurately reflects product inventory at the time orders are placed and minimize the impact on customers What should you do?

Options:

A.

Decrease the acknowledgment deadline on the subscription

B.

Add a virtual queue to the online store that allows typical traffic levels

C.

Increase the number of Pod replicas

D.

Increase the Pod CPU and memory limits

Expert Solution
Questions # 54:

You need to run a business-critical workload on a fixed set of Compute Engine instances for several months. The workload is stable with the exact amount of resources allocated to it. You want to lower the costs for this workload without any performance implications. What should you do?

Options:

A.

Purchase Committed Use Discounts.

B.

Migrate the instances to a Managed Instance Group.

C.

Convert the instances to preemptible virtual machines.

D.

Create an Unmanaged Instance Group for the instances used to run the workload.

Expert Solution
Questions # 55:

Your team is designing a new application for deployment both inside and outside Google Cloud Platform (GCP). You need to collect detailed metrics such as system resource utilization. You want to use centralized GCP services while minimizing the amount of work required to set up this collection system. What should you do?

Options:

A.

Import the Stackdriver Profiler package, and configure it to relay function timing data to Stackdriver for further analysis.

B.

Import the Stackdriver Debugger package, and configure the application to emit debug messages with timing information.

C.

Instrument the code using a timing library, and publish the metrics via a health check endpoint that is scraped by Stackdriver.

D.

Install an Application Performance Monitoring (APM) tool in both locations, and configure an export to a central data storage location for analysis.

Expert Solution
Questions # 56:

You recently noticed that one of your services has exceeded the error budget for the current rolling window period. Your company’s product team is about to launch a new feature. You want to follow Site Reliability Engineering (SRE) practices. What should you do?

Options:

A.

Notify the team about the lack of error budget and ensure that all their tests are successful so the launch will not further risk the error budget.

B.

Notify the team that their error budget is used up. Negotiate with the team for a launch freeze or tolerate a slightly worse user experience.

C.

Escalate the situation and request additional error budget.

D.

Look through other metrics related to the product and find SLOs with remaining error budget. Reallocate the error budgets and allow the feature launch.

Expert Solution
Questions # 57:

You are running an application on Compute Engine and collecting logs through Stackdriver. You discover that some personally identifiable information (PII) is leaking into certain log entry fields. You want to prevent these fields from being written in new log entries as quickly as possible. What should you do?

Options:

A.

Use the filter-record-transformer Fluentd filter plugin to remove the fields from the log entries in flight.

B.

Use the fluent-plugin-record-reformer Fluentd output plugin to remove the fields from the log entries in flight.

C.

Wait for the application developers to patch the application, and then verify that the log entries are no longer exposing PII.

D.

Stage log entries to Cloud Storage, and then trigger a Cloud Function to remove the fields and write the entries to Stackdriver via the Stackdriver Logging API.

Expert Solution
Questions # 58:

Your team is designing a new application for deployment into Google Kubernetes Engine (GKE). You need to set up monitoring to collect and aggregate various application-level metrics in a centralized location. You want to use Google Cloud Platform services while minimizing the amount of work required to set up monitoring. What should you do?

Options:

A.

Publish various metrics from the application directly to the Slackdriver Monitoring API, and then observe these custom metrics in Stackdriver.

B.

Install the Cloud Pub/Sub client libraries, push various metrics from the application to various topics, and then observe the aggregated metrics in Stackdriver.

C.

Install the OpenTelemetry client libraries in the application, configure Stackdriver as the export destination for the metrics, and then observe the application's metrics in Stackdriver.

D.

Emit all metrics in the form of application-specific log messages, pass these messages from the containers to the Stackdriver logging collector, and then observe metrics in Stackdriver.

Expert Solution
Questions # 59:

Your company follows Site Reliability Engineering practices. You are the Incident Commander for a new. customer-impacting incident. You need to immediately assign two incident management roles to assist you in an effective incident response. What roles should you assign?

Choose 2 answers

Options:

A.

Operations Lead

B.

Engineering Lead

C.

Communications Lead

D.

Customer Impact Assessor

E.

External Customer Communications Lead

Expert Solution
Questions # 60:

You are running an application in a virtual machine (VM) using a custom Debian image. The image has the Stackdriver Logging agent installed. The VM has the cloud-platform scope. The application is logging information via syslog. You want to use Stackdriver Logging in the Google Cloud Platform Console to visualize the logs. You notice that syslog is not showing up in the "All logs" dropdown list of the Logs Viewer. What is the first thing you should do?

Options:

A.

Look for the agent's test log entry in the Logs Viewer.

B.

Install the most recent version of the Stackdriver agent.

C.

Verify the VM service account access scope includes the monitoring.write scope.

D.

SSH to the VM and execute the following commands on your VM: ps ax I grep fluentd

Expert Solution
Viewing page 6 out of 7 pages
Viewing questions 51-60 out of questions