
Each Region value appears only on the tow where it first occurred. Each subsequent occurrence of the Region value is blank.
You need to ensure that every row contains the connect non-blank value The solution must minimize development effort.
Which column should you select, and which action should you perform on the column? To answer, select the appropriate options in the answer area. NOTE; Each connect selection is worth one point.

You ate creating a Power 81 report that will show the number of current employees over time. The report will use Import storage mode for all tables.
The employment data will be imported from Azure SQL Database in a monthly snapshot. The data will be stored in a table named Headcount and will contain the following:
• One row per employee for each month the employee is employed
• In each row, a date key that shows the first day of the month of each snapshot
You have a related date table that contains dates for the years 2020 to 2030.

You are using Power Bi Desktop to connect to an Azure SQL database The connection is configured as shown in the following exhibit.


Use the drop-down menus to select the answer choice that completes each statement based on the information presented in the graphic NOTE: Each correct solution is worth one point

You plan to create a Power Bl dataset to analyze attendance at a school. Data will come from two separate views named View1 and View? in an Azure SQL database. View1 contains the columns shown in the following table.

View2 contains the columns shown in the following table.

The views can be related based on the Class ID column.
Class ID is the unique identifier for the specified class, period, teacher, and school year. For example, the same class can be taught by the same teacher during two different periods, but the class will have a different class ID.
You need to design a star schema data model by using the data in both views. The solution must facilitate the following analysis:
The count of classes that occur by period
The count of students in attendance by period by day
The average number of students attending a class each month
In which table should you include the Teacher First Name and Period Number fields? To answer, select the appropriate options in the answer area.
NOTE: Each correct selection is worth one point.

You are designing the data model for a Power Bl semantic model. You have the following tables in the star schema.

Which table is the fact table of the star schema, and which column in the Patient table is the surrogate key of the star schema? To answer, select the appropriate options in the answer area.
NOTE: Each correct selection is worth one point.

You are creating a Power Bi model and report.
You have a single table in a data mode) named Product Product contains the following fields:
• ID
• Name
• Color
• Category
• Total Sales
You need to create a calculated table that shows only the top eight products based on the highest value in Total Sales.
How should you complete the DAX expression? To answer, drag the appropriate values to the coned targets. Each value may be used once, more than once, or not at all. You may need to drag the split bar between panes or scroll to view content.

You receive annual sales data that must be included in Power Bl reports.
From Power Query Editor, you connect to the Microsoft Excel source shown in the following exhibit.

You need to create a report that meets the following requirements:
• Visualizes the Sales value over a period of years and months
• Adds a slicer for the month
• Adds a slicer for the year

You have a Power BI report. The report contains visualizations that have interactions. You need to identify which visualizations take the longest to complete. What should you use?
Note: This question is part of a series of questions that present the same scenario. Each question in the series contains a unique solution that might meet the stated goals. Some question sets might have more than one correct solution, while others might not have a correct solution.
After you answer a question in this section, you will NOT be able to return to it. As a result, these questions will not appear in the review screen.
From Power Query Editor, you profile the data shown in the following exhibit.
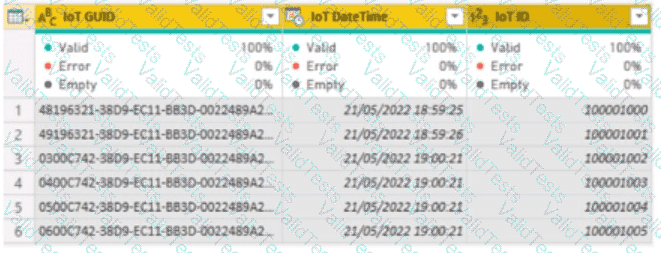
The IoT GUID and IoT ID columns are unique to each row in query.
You need to analyze IoT events by the hour and day of the year. The solution must improve dataset performance.
Solution: You split the loT DateTime column into a column named Date and a column named Time.
Does this meet the goal?
You have a Microsoft Excel workbook that contains two tables.
From Power BI, you create a dashboard that displays data from the tables.
You update the tables each day.
You need to ensure that the virtualizations in the dashboard are updated daily.
Which three actions should you perform in sequence? To answer, move the appropriate actions from the list of actions to answer area and arrange them in the correct order.


