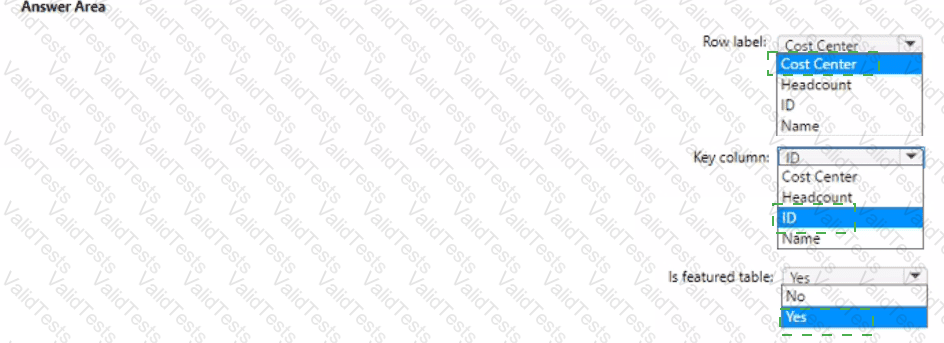
You create a Power Bl dataset that contains the table shown in the following exhibit.
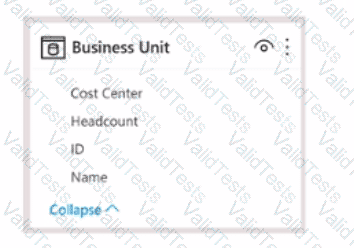
You need to make the table available as an organizational data type In Microsoft Excel.
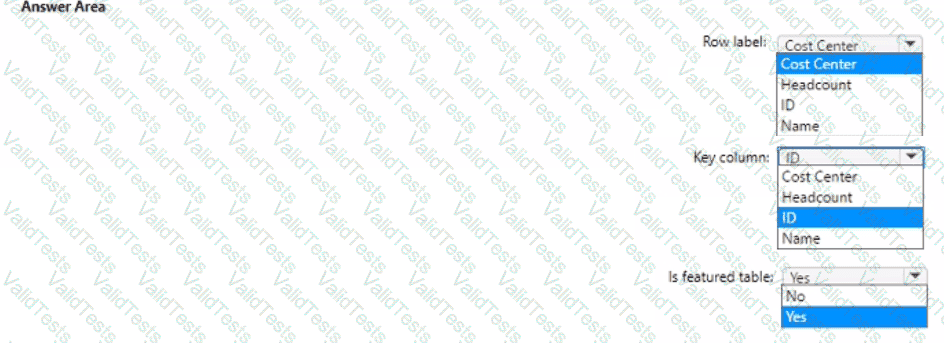
How should you configure the properties of the table? To answer select the appropriate options in the answer area.
NOTE: Each correct selection is worth one point.
You have a source that contains a comumn. The column contains case sensitive date. You have a Power BI semantic model in DirectQuery mode. You connect to the model and discover that it contains undefined values and errors. You need to resolve the issue.
Solution: You change the semantic model mode.
Does this meet the goal?
You need to use Power B1 to create a visual that will allow users to compare the sales performance of five sales regions for the current month.
Which visual should you use?
You are creating a Microsoft Power Bl imported data model to perform basket analysis. The goal of the analysis is to identify which products are usually bought together in the same transaction across and within sales territories.
You import a fact table named Sales as shown in the exhibit. (Click the Exhibit tab.)
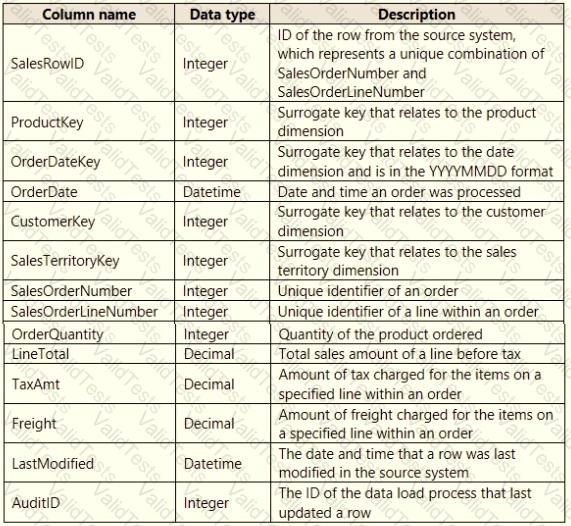
The related dimension tables are imported into the model.
For each of the following statements, select Yes if the statement is true. Otherwise, select No.
NOTE: Each correct selection is worth one point.

You have a collection of reports for the HR department of your company.
You need to create a visualization for the HR department that shows historical employee counts and predicts trends during the next six months.
Which type of visualization should you use?
Your organization has a team of power users who recently created 20 Power BI dashboards.
The power users share the dashboards with other users in the organization.
When the users attempt to access the dashboards, they receive the error message shown in the exhibit. (Click the Exhibit.)
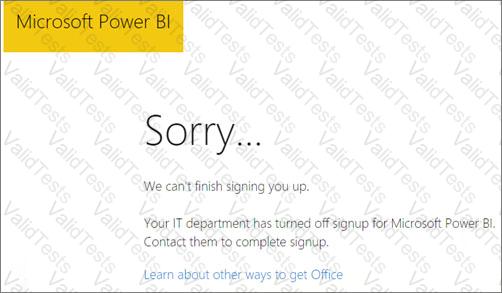
You need to ensure that all the users can access the dashboards.
What should you do first?
You have a Power Bl semantic model that contains two queries.
You discover that a report based on the model has performance issues.
You plan to use Power Query to reduce the data loaded to the model.
Which two actions should you perform? Each correct answer presents part of the solution.
NOTE: Each correct answer is worth one point.
NO: 18
You embed a Power BI report in a Microsoft SharePoint Online page.
A user name User1 can access the SharePoint Online page, but the Power BI web part displays the following error message: “This content isn’t available”.
User1 is unable to view the report.
You verify that you can access the SharePoint Online page and that the Power BI report displays as expected.
You need to ensure that User1 can view the report form SharePoint Online.
What should you do?
Note: This question is part of a series of questions that present the same scenario. Each question in the series contains a unique solution that might meet the stated goals. Some question sets might have more than one correct solution, while others might not have a correct solution.
After you answer a question in this section, you will NOT be able to return to it. As a result, these questions will not appear in the review screen.
You are modeling data by using Microsoft Power BI. Part of the data model is a large Microsoft SQL Server table named Order that has more than 100 million records.
During the development process, you need to import a sample of the data from the Order table.
Solution: From Power Query Editor, you import the table and then add a filter step to the query.
Does this meet the goal?
What should you do to address the existing environment data concerns?