View all detail and faqs for the Analytics-DA-201 exam
A Data Analyst is creating an annual report in Microsoft Word.
In Tableau Desktop, the analyst built a chart in a worksheet.
The analyst wants to create an image of the chart to add to the annual report.
Which two options should the analyst use to create the image? (Choose two.)
A Data Analyst has received a request to provide a dashboard related to employee time logs. The employees are entering their time using mobile devices throughout the day and data is stored in a cloud-based database. The end users would like to receive data on their dashboard in as close to real-time as possible.
How should the analyst best create a data source to meet these requirements?
You have the following chart that sorts states by the number of products each state has purchased.
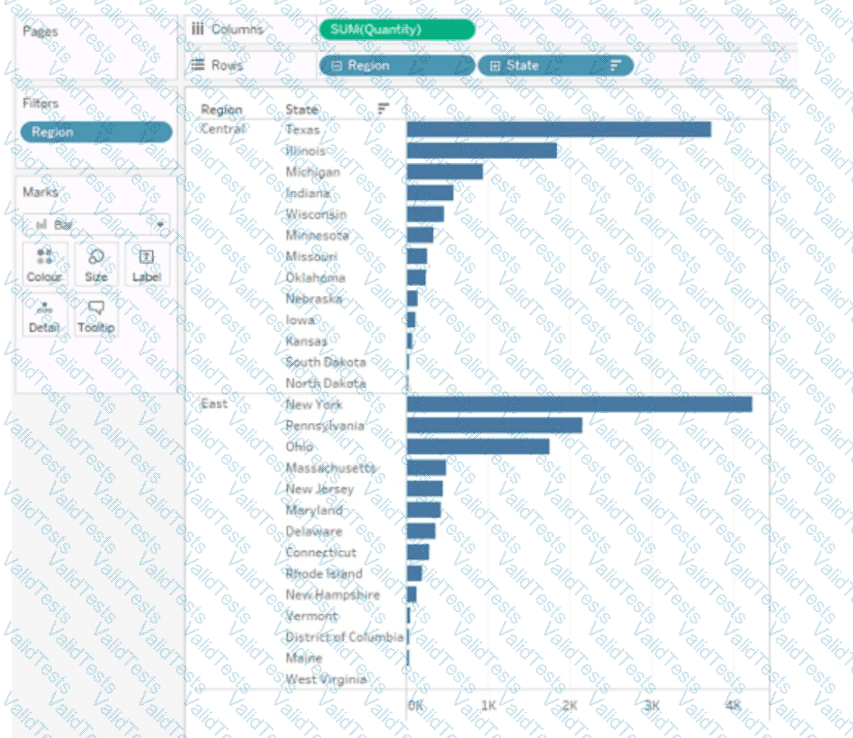
Which formula should you use to include a number with the position of each state within each region?
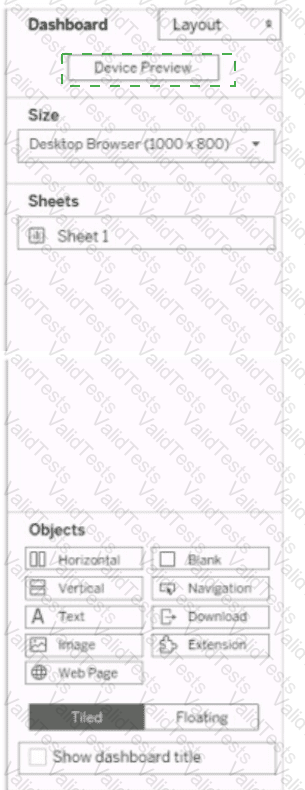
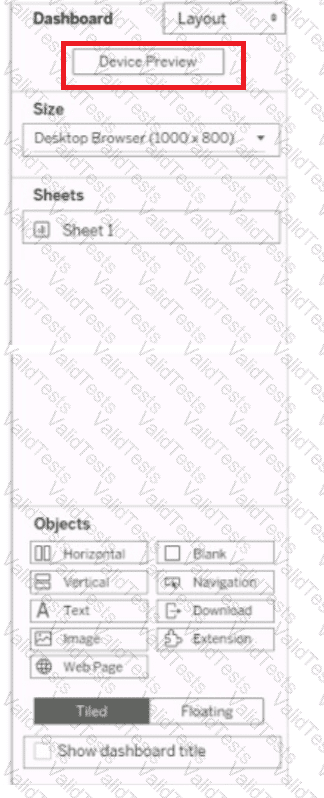
You have a dashboard that is configured for desktop browsers.
You want to customize a layout for mobile users.
Which option should you select first? (Click the appropriate Option in the Answer Area.)
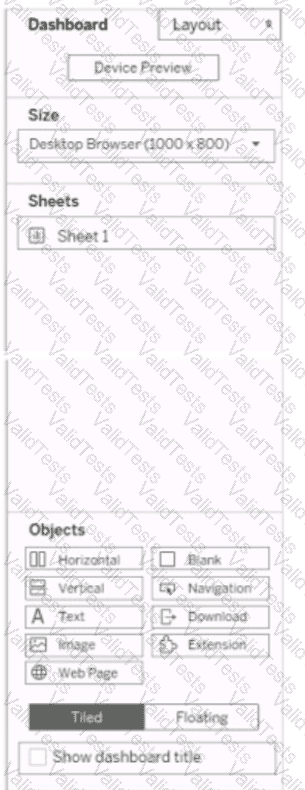
You are creating a new dashboard.
You need to add a button to the dashboard that allows users to export the dashboard as an image.
Which type of object should you use?
A Data Analyst has the following dashboard.
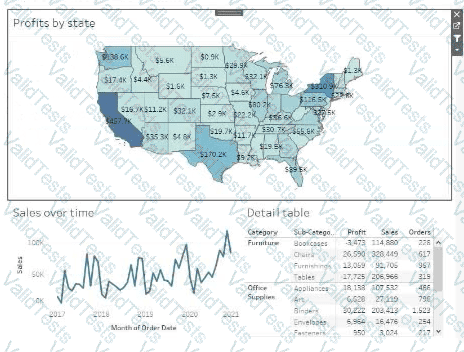
Currently, the map is used as a filter that affects the data on the other sheets of the dashboard.
The analyst needs to configure the dashboard to ensure that selecting a data point on the map only filters the Detail table.
What should the analyst do?
You have the following dataset that contain null values in the Profits field.
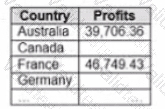
You want the data to appear as shown in the following table.
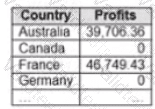
Which two formulas achieve the goal? Choose two.
A Data Analyst is using containers on a dashboard.
How should the analyst make sure multiple objects within a container are always taking up the same width or height, even if the container is resized?
A Data Analyst is given the following table and asked to create a flow that adds a date field to the data. This field should automatically update as new dates (months) are added to the original table.
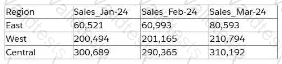
Which technique should the analyst use as the first step to achieve this in Tableau Prep?
You create the following worksheet
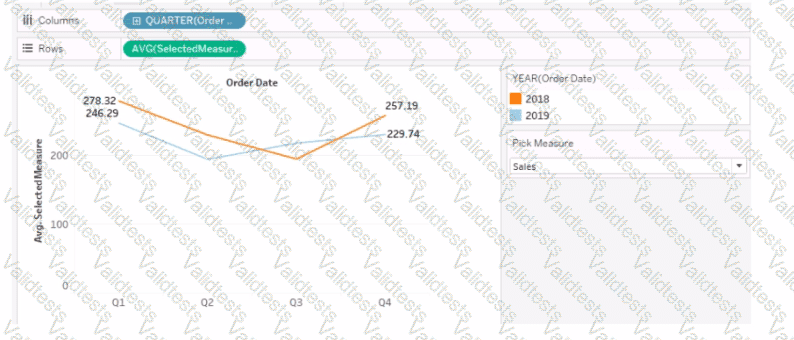
The Pick Measure parameter contains the following list of values
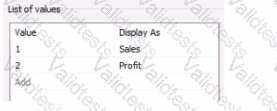
Users can select a value from Pick Measure to change the visualization to show either the Sales measure or the Profit measure.
Which formula is used in the Selected Measure calculated field lo switch between measures?