View all detail and faqs for the Analytics-DA-201 exam
You want to connect a Tableau workbook to a dataset in a Microsoft Excel spreadsheet.
What should you do from Tableau Desktop?
You have a database that includes field named sales, City and Region.
You have the following chart that shows the number of sales made in different cities.
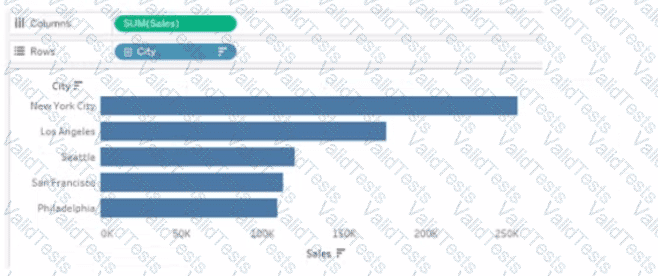
You want to dynamically show the corresponding region when users hover their mouse over any of the bars.
What should you do?
You have the following box plot that shows the distribution of average profits made in every state by region.

Which region has the smallest distribution of profits?
You have the following dashboard.
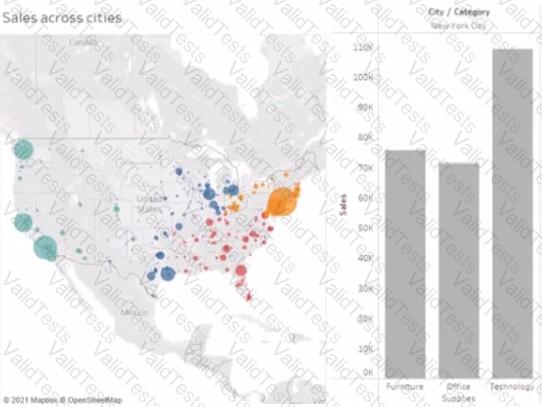
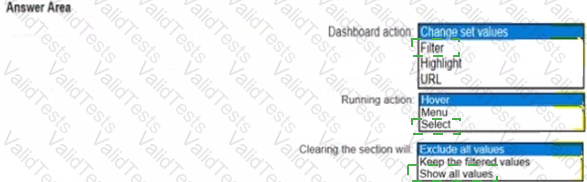
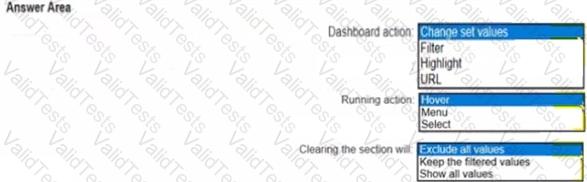
When a user selects a only on the map the data on the bar chart must show only the data for the selected city. The data in the bar chart must change only when the user selects a different city How should you configure the dashboard action? (Use the dropdowns in the Answers Area to select the correct options.)
You publish a dashboard tut uses an attract. The extract refreshes every Monday at 10:00.
You need to ensure that the extract also refreshes on the last day of the month at 18:00.
What should you do?
You want to add a comment to March 2020 as shown in the following visualization.
You have the following sets in a Tableau workbook
• Top N Customers
• Customers of 2020
• Top N Products
• Sellers of 2020
Which two sets can you combine? Choose two
You are the owner of an alert.
You receive an email notification that the alert was suspended
From where can you resume the suspended alert?
You have the following dataset.
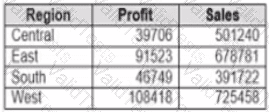
You need to create the following worksheet.
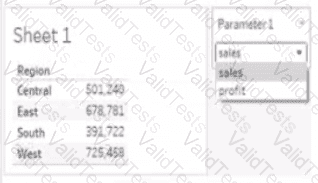
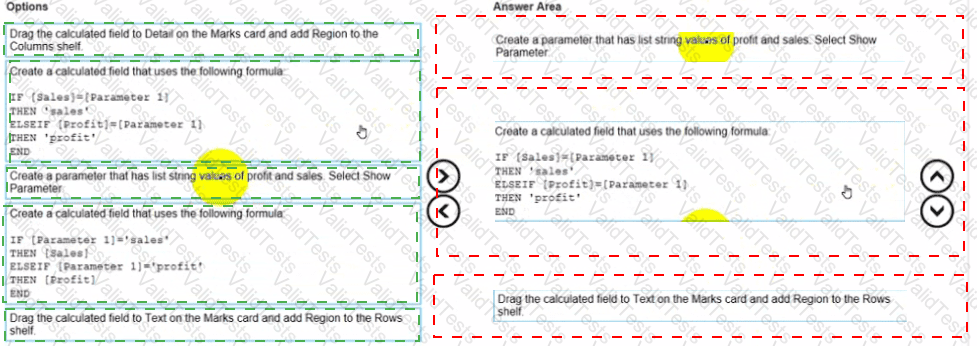
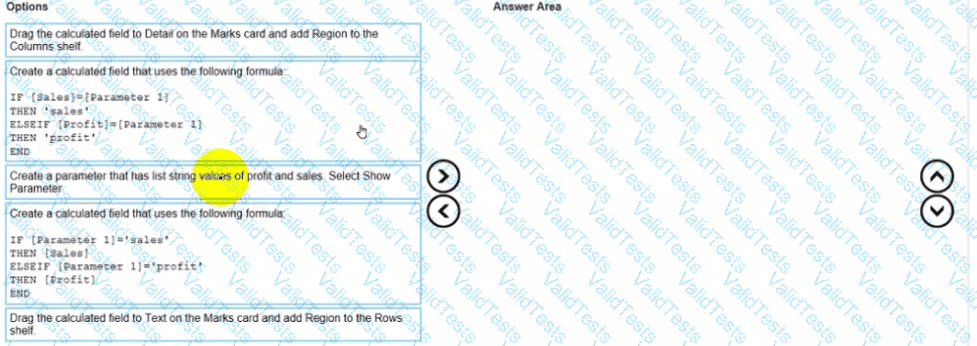
The table must show either profit or sales based on the selection from the Parameter 1 menu.
Which three actions should you perform in orders
(Place the three correct options in order Use the arrows to move Options lo Answer Area Use Answer Area arrows to reorder the options)
A Data Analyst needs to update an existing dashboard. The current dashboard shows financial results data, and users have asked for a comparison of budgets to be added to the dashboard. A new data source has been created that includes both the actual costs and budgets and was published to the corporate Tableau site.
How should the analyst update the existing dashboard?
A Data Analyst has the following dataset in Microsoft Excel.
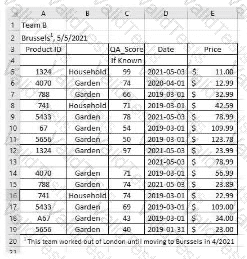
The analyst is using Data Interpreter to cleanse the dataset. Data Interpreter provides the following results.
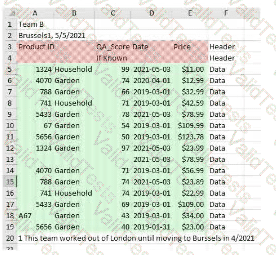
How many rows of data will be ingested into Tableau as values?