You have the following data source in tableau Server.
You need to ensure that the data is updated every hour.
What should you select?
You have the following dataset.
Which Level of Detail (LOD) expression should you use to calculate tie grand total of all the regions?
You are the owner of an alert.
You receive an email notification that the alert was suspended
From where can you resume the suspended alert?
A colleague provides you with access to a folder that contains the following files:
• Sates.csv
• Bookl.twb
• Sates.hyper
• Export.mdb
Which He contains an extract?
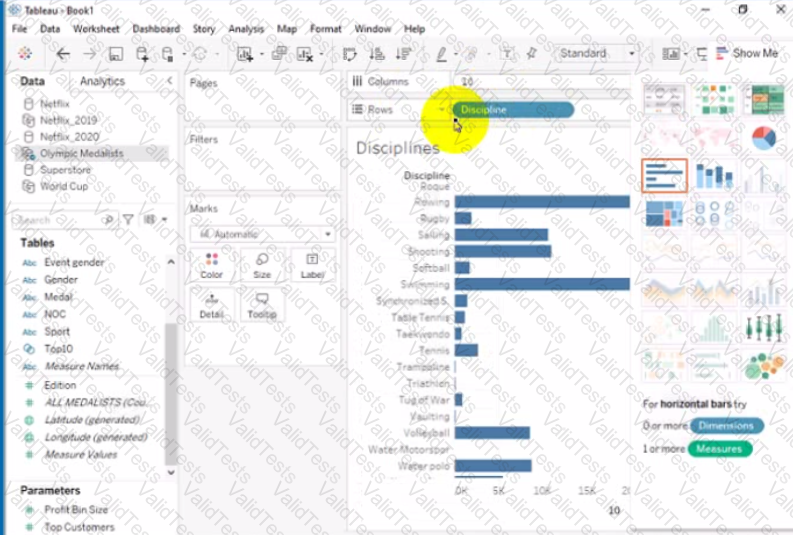
Open the link to Book1 found on the desktop. Open Disciplines worksheet.
Filter the table to show the members of the Top10 set and the members of the Bottom10 set. There should be a total of 20 rows.
Open the link to Book1 found on the desktop. Open the Movie Durations worksheet.
Replace the existing data source with the Netflix_2019 data source.
Open the link to Book1 found on the desktop. Open SalesVSProfit worksheet.
Add a distribution band on Profit to show the standard deviation from- 1 to 1.
Open the link to Book1 found on the desktop. Open the Histogram worksheet and use the Superstone data source.
Create a histogram on the Quantity field by using bin size of 3.
Open the Link to Book1 found on the desktop. Open Map worksheet and use Superstore data source.
Create a filed map to show the distribution of total Sales by State across the United States.
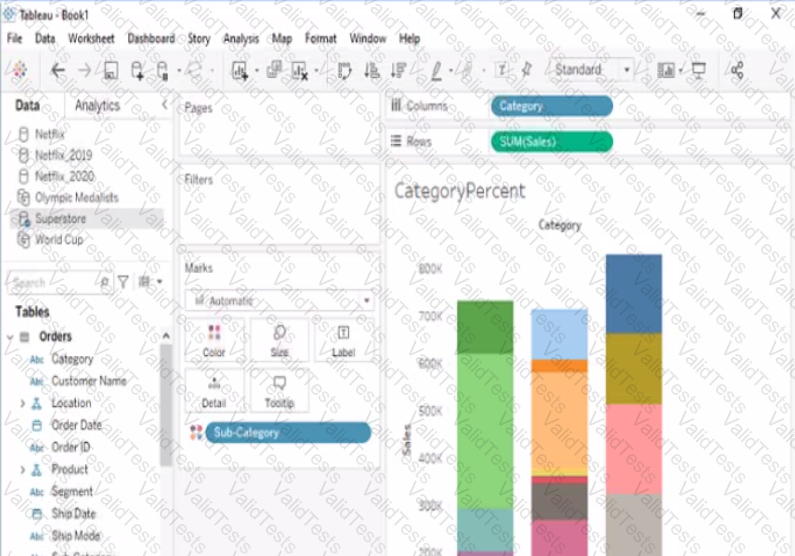
Open the link to Book1 found on the desktop. Open the CategoryPercentage worksheet.
Modify the bar chart show the percentage of sales for each Subcategory within every Category. The total percentage for every Category must be 100%.