Open the link to Book1 found on the desktop. Open the sales dashboard.
Add the Sales by State sheet in a Show/Hide button to the right side of the dashboard.
Open the link to Book1 found on the desktop. Open Disciplines worksheet.
Filter the table to show the Top 10 NOC based on the number of medals won.
Open the link to Book1 found on the desktop. Open the Line worksheet.
Modify the chart to show only main and max values of both measures in each region.
Open the link to Book1 found on the desktop. Use the Superstore data source.
Split the Customer Name field into two fields named First Name and Last Name.
You create the following story that contains two story point.
You want to change the story point format to show the current story point number out of the total number of story points.
Which Layout option should you use?
When a Data Analyst needs to format workbook settings, which options are available in the Format Workbook panel?
You have a Tableau Prep flow that joins a dataset named Global Indicators to a dataset named Price Indices.
In which step can you transform rows of monthly data into rows of yearly data''

You have a data source that contains the following columns.
You want to filter regions based on the highest sales. Users must be able to specify the number of regions shown.
Which three actions should you perform in order? (Place the three correct options in order. Use the arrows to move Options to Answer Area.
Use Answer Area arrows to re-order the options.)
Below are some of the values in the Order_ID field:

Which calculation should a Data Analyst use to return the two-letter combinations starting with the letter "P" for each of these values?
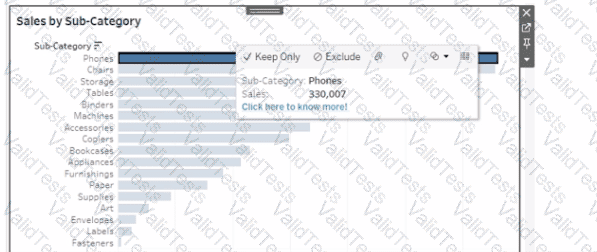
You want to ensure that when you click a bar on a dashboard, a tooltip appears that contains a link named "Click here to know more!" as shown in the following exhibit.