You create a dashboard by using the Microsoft Power Bl Service. The dashboard contains a card visual that shows total sales from the current year. You grant users access to the dashboard by using the viewer role on the workspace. A user wants to receive daily notifications of the number shown on the card visual. You need to automate the notifications. What should you do?
You have a Power B1 dataset that contains quarterly sales performance data.
You need to enable managers to review the data in a format that meets the following requirements:
• Is optimized for printing.
• Renders data in Microsoft Excel, Word, PowerPoint, and PDF formats.
What should you create?
You have a folder that contains 100 CSV files.
You need to make the file metadata available as a single dataset by using Power Bi The solution must NOT store the data of the CSV files.
Which three actions should you perform in sequence. To answer, mow the appropriate actions from the list of actions to the answer area and arrange them m the correct order.
NOTE; More than one order of answer choices is correct. You will receive credit for any of the correct orders you select.

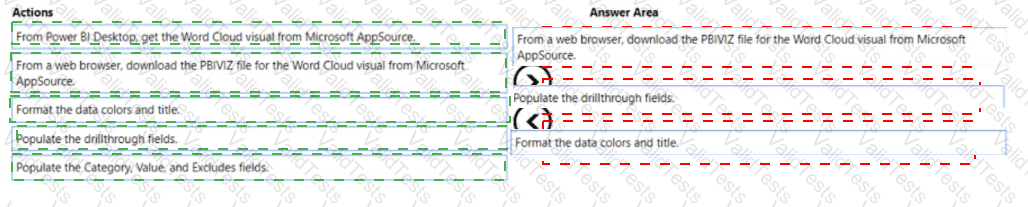
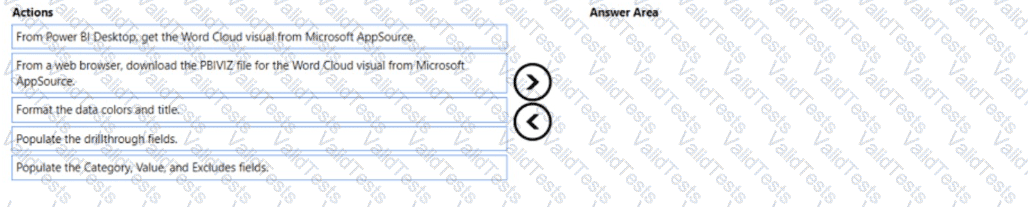
You use Power Bi Desktop to create a Power Bl data model and a blank report. You need to add the Word Cloud visual shown in the following exhibit to the report.

The solution must minimize development effort
Which three actions should you perform in sequence? To answer, move the appropriate actions from the list of actions to the answer area and arrange them in the correct order.
You have multiple dashboards.
You need to ensure that when users browse the available dashboards from powerbi.com, they can see which dashboards contain Personally Identifiable Information (PII). The solution must minimize configuration effort and impact on the dashboard design.
What should you use?
You build a report to help the sales team understand its performance and the drivers of sales. The team needs to have a single visualization to identify which factors affect success. Which type of visualization should you use?
-
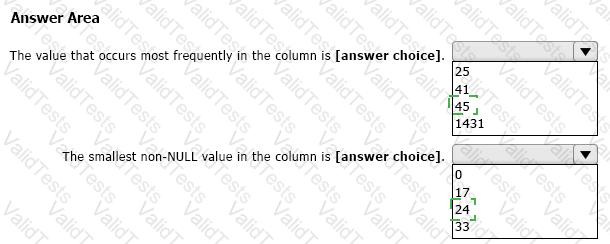
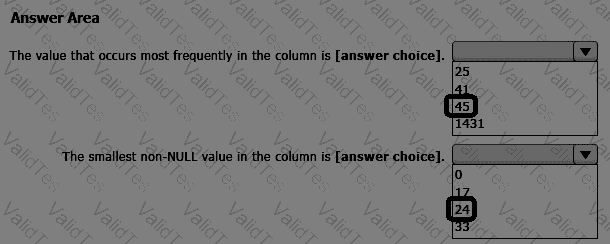
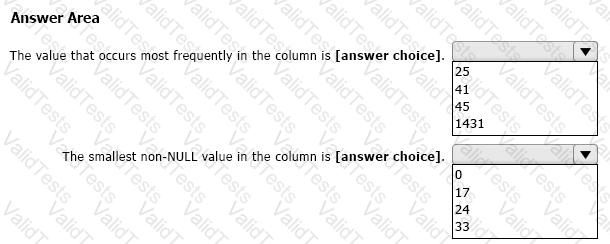
You are using Power Query Editor to preview the data in a column named Max Temp. The column statistics and value distribution are shown in the following exhibit.
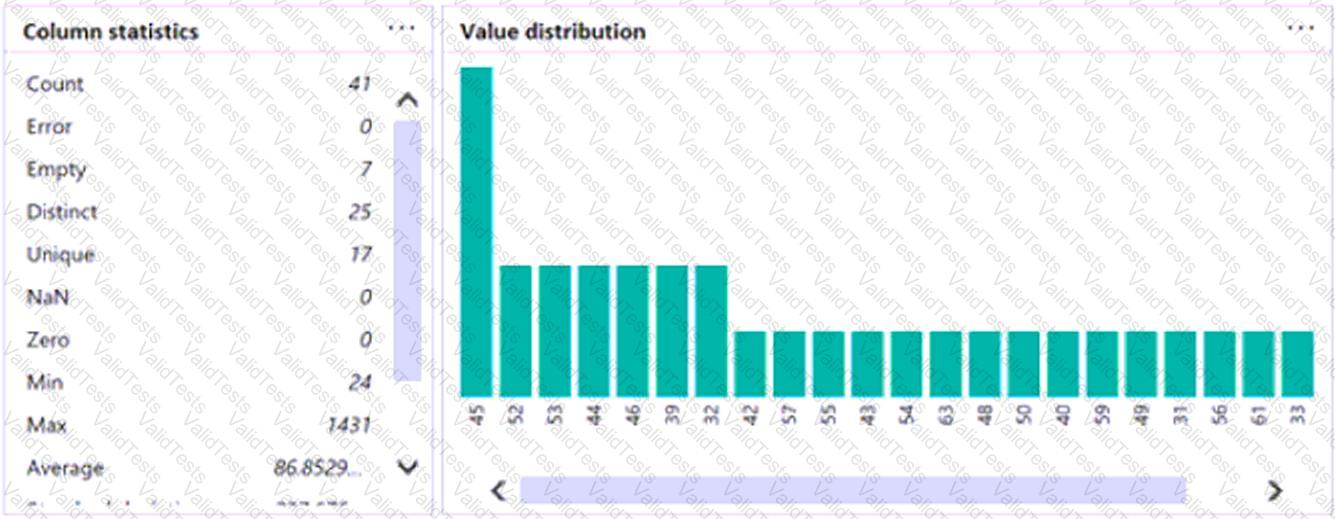
Use the drop-down menus to select the answer choice that completes each statement based on the information presented in the graphic.
NOTE: Each correct selection is worth one point.
You have a semantic model that contains two tables named Sales and Date. The Sales table relates to the Date table by using a many-to-one relationship. The Sales table contains the following columns:
• Date
• Product
• SalesAmount
You need to create a DAX measure for a rolling 31 -day sales total that will return the total sales amount for a selected date and the previous 30 days.
Which DAX expression should you use?
You are creating a Power Bl report by using Power Bi Desktop.
You need to include a visual that shows trends and other useful information automatically. The visual must update based on selections in other visuals.
Which type of visual should you use?
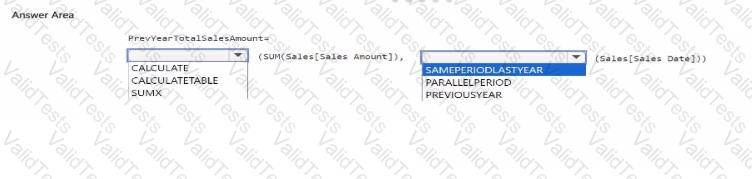
You have a semantic model that contains a table named Sales. The table contains the following columns;
• Order ID
• Product ID
• Sales Dote
• Sales Amount
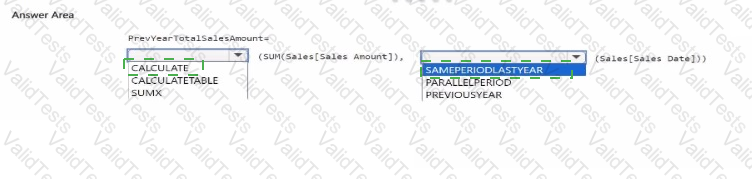
You need to create a DAX measure that will return the total sales amount for the same dates from the previous year. How should you complete the measure? To answer, select the appropriate options m the answer area.
NOTE: Each correct selection is worth one point.